


Introduction: Why Digital Assets Matter Now
Digital assets and cryptocurrency are no longer fringe technologies or speculative experiments. They represent a fundamental shift in how value is stored, transferred, and managed globally.
Around the world, physical cash usage continues to decline as digital payment systems become the default for everyday transactions. At the same time, programmable money — money that can follow rules, conditions, and logic — is emerging through blockchain-based systems.
Governments, financial institutions, and major corporations are actively researching, piloting, or adopting blockchain infrastructure to improve settlement speed, transparency, and resilience. This shift is not driven by ideology, but by structural inefficiencies in legacy financial systems.
Understanding digital currency is increasingly becoming a basic form of financial literacy — similar to understanding online banking or digital payments in previous decades.
This transition is structural, not a trend.
- Digital Currency: A digital representation of value.
- Fiat Money: Government-issued currency.
- Decentralization: Distribution of power away from a central authority.
Why Digital Currency Is Replacing Fiat Currency
Why trust, control, and access are shifting away from traditional systems.
What Is Blockchain Technology?
The infrastructure that enables transparency without intermediaries.
Stability: Blockchain Systems vs Fiat Systems
How different monetary systems handle risk, inflation, and failure.
Decentralized Finance (DeFi): The Next Financial Layer
Financial tools rebuilt without banks or centralized gatekeepers.
Understanding Cryptocurrency Markets Responsibly
How to engage with volatile markets without speculation or hype.
TradingView: A Practical Guide for Chart Analysis
Tools for reading market structure, trends, and price behavior.
What Is Digital Currency?

Digital currency is a form of money that exists electronically rather than physically. It is designed to be transferred digitally between parties without the need for physical cash.
Unlike traditional fiat money, which is issued and controlled by central authorities, many digital currencies operate on decentralized networks that allow peer-to-peer value transfer.
Key characteristics of digital currency include:
- Digital scarcity — supply rules are defined by code rather than policy
- Peer-to-peer transactions — value can move directly between users
- Borderless transfer — transactions are not limited by geography
- Transparency — transactions can be publicly verifiable rather than opaque
Digital currencies do not replace fiat money overnight, but they introduce alternative monetary systems with different rules and tradeoffs.
Why Digital Currency Is Replacing Fiat Currency

Traditional fiat currency systems face increasing structural challenges, including:
- Inflation and long-term currency debasement
- Centralized monetary control
- Debt-based expansion models
- Limited transparency in issuance and settlement
Digital currencies challenge these weaknesses by introducing new monetary properties:
- Fixed or algorithmically defined supply
- Verifiable issuance and circulation
- Immutable transaction histories
- Reduced reliance on intermediaries
This evolution is not rooted in conspiracy or collapse narratives. It reflects a natural progression toward systems that are more transparent, auditable, and globally interoperable.
Blockchain technology is a distributed ledger system that records transactions across a network of independent participants.
Instead of relying on a single centralized database, blockchain systems use:
- Blocks — groups of recorded transactions
- Consensus mechanisms — rules that determine agreement across the network
- Distributed validation — many participants verify records independently
Because each block is cryptographically linked to the previous one, altering past records becomes extremely difficult without network-wide agreement.
Public blockchains are not controlled by any single entity. Security emerges from mathematics, cryptography, and network consensus — not authority or trust in a central institution.
What Is Blockchain Technology?

A critical distinction must be made:
Price volatility does not equal system instability.
While digital asset prices can fluctuate, blockchain networks themselves are often more resilient than traditional financial infrastructure.
Key stability advantages include:
- Decentralization removes single points of failure
- Censorship and transaction manipulation are more difficult
- Network uptime does not depend on one institution or jurisdiction
In contrast, fiat systems rely heavily on centralized intermediaries, making them more vulnerable to outages, freezes, and policy-driven disruptions.
Stability: Blockchain Systems vs Fiat Systems

Decentralized Finance (DeFi): The Next Financial Layer

Decentralized Finance (DeFi) refers to financial systems built on blockchain networks that operate without traditional intermediaries such as banks or brokers.
DeFi uses smart contracts — automated programs that execute financial logic transparently and predictably.
Core characteristics of DeFi include:
- Permissionless access
- Global participation
- Transparent rules encoded in software
- User responsibility for risk and security
DeFi is not risk-free, but it represents a structural transformation in how financial services can be accessed and governed.
Understanding Cryptocurrency Markets Responsibly

Cryptocurrency markets are influenced by liquidity, psychology, and structural dynamics — not certainty or guarantees.
Education matters more than prediction. Analytical tools help interpret behavior, not forecast outcomes.
Responsible participation begins with understanding risk, volatility, and context rather than chasing short-term results.
TradingView: A Practical Guide for Chart Analysis
What Is TradingView?
TradingView is a widely used charting and analysis platform utilized by traders, analysts, and investors worldwide.
It supports multiple asset classes, including cryptocurrency, stocks, and foreign exchange, and is designed for visual market analysis rather than automated decision-making.
The following TradingView setup is best paired with the weekly supercharts using TradingView Pro +
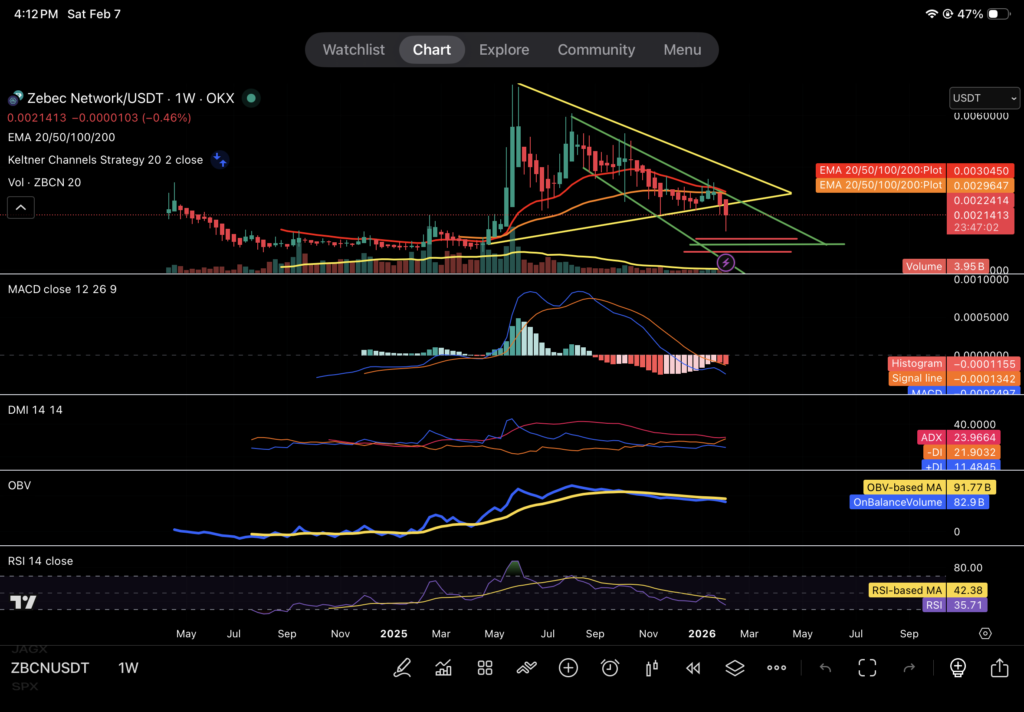
Core Indicators for Consistent Chart Reading
This indicator stack is designed to reduce noise, reveal structure, and highlight moments where market behavior aligns across trend, momentum, volatility, and participation.
No single indicator produces accuracy on its own.
High-probability conditions emerge only when multiple components agree.
This approach emphasizes confluence, not prediction.
Price Pane Indicators
Exponential Moving Averages (EMA 20, 50, 100, 200)
Why they are used:
- EMAs reveal short-, mid-, and long-term trend structure
- Faster EMAs (20, 50) show active momentum
- Slower EMAs (100, 200) define macro bias and dynamic support/resistance
What to Observe:
- EMA alignment (stacking) in one direction
- Price respecting EMAs as support or resistance
- Compression before expansion when EMAs tighten
High-Probablity Conditions Occur When:
• Price aligns above or below multiple EMAs
•Pullbacks respect higher-timeframe EMAs
•Lower timeframes confirm higher-timeframe direction
Keltner Channels (ATR-Based)
Why they are used:
- Keltner Channels measure volatility expansion and contraction
- ATR-based bands adjust dynamically to market conditions
- Help distinguish trending movement from range behavior
What to Observe:
- Price walking the upper or lower channel
- Compression inside the channel before expansion
- Breakouts supported by volume and trend alignment
High-Probablity Conditions Occur When:
- Price expands from compression with trend confirmation
- Channel direction matches EMA structure
- Volatility expands after consolidation
Indicator Panes
1. MACD (12, 26, 9)
Why it is used:
- Measures momentum shifts and trend continuation
- Identifies early changes in directional strength
What to observe:
- Histogram expansion in trend direction
- Signal line cross aligned with EMA bias
- Divergence as a warning, not a signal
High-probability conditions occur when:
- MACD momentum agrees with price structure
- Crosses occur above or below the zero line with trend
- Expansion follows consolidation
2. ADX with +DI / –DI (Length 14)
Why it is used:
- Measures trend strength, not direction
- Separates trending markets from ranging markets
What to observe:
- ADX rising above key thresholds
- +DI and –DI clearly separated
- Strength confirmation before continuation
High-probability conditions occur when:
- ADX is rising and confirms EMA direction
- Directional lines agree with price movement
- Trades are avoided when ADX is flat or declining
3. Volume with Moving Average (20)
Why it is used:
- Confirms whether price movement has participation
- Filters false breakouts and weak moves
What to observe:
- Volume expansion during breakouts
- Volume contraction during consolidation
- Volume confirming trend continuation
High-probability conditions occur when:
- Breakouts occur with above-average volume
- Pullbacks happen on declining volume
- Expansion follows periods of low participation
4. On-Balance Volume (OBV)
Why it is used:
- Tracks accumulation and distribution
- Reveals hidden participation before price reacts
What to observe:
- OBV making higher highs or lower lows
- OBV leading price movement
- Divergence as early structure change
High-probability conditions occur when:
- OBV confirms price trend
- OBV breaks structure before price
- Accumulation aligns with EMA and volume behavior
5. Relative Strength Index (RSI 14)
Why it is used:
- Measures momentum, not overbought/oversold timing
- Helps identify trend health
What to observe:
- RSI holding above or below key zones
- Momentum shifts during pullbacks
- Failure swings as warnings
High-probability conditions occur when:
- RSI holds bullish or bearish ranges
- Pullbacks occur without momentum breakdown
- RSI confirms continuation rather than exhaustion
6. ATR (14)
Why it is used:
- Measures volatility conditions
- Identifies contraction before expansion
What to observe:
- ATR compression followed by expansion
- Squeeze conditions resolving with direction
- Volatility aligning with trend bias
High-probability conditions occur when:
- Volatility expands after prolonged compression
- Direction matches EMA and ADX confirmation
- Expansion is supported by volume
How High-Probability Conditions Emerge (80–92% Range)
High-confidence conditions are not constant and not guaranteed.
They occur only when all of the following align:
- Higher timeframe trend defines direction
- EMAs are stacked and respected
- Momentum indicators confirm direction
- ADX confirms trend strength
- Volume confirms participation
- Volatility expands after compression
When these factors align simultaneously, probability increases significantly; often into the 80–92% consistency range; under specific market conditions.
Outside of alignment, probability drops sharply.
Key Principle
Indicators do not create accuracy.
Alignment does.
This stack is designed to remove guesswork, reduce emotional decision-making, and improve consistency; not to predict outcomes or eliminate risk.
Important Note
This indicator framework is provided for educational purposes only.
It does not constitute financial or trading advice.
Market risk always exists, and no system produces certainty.

Ready to Apply What You Have Learned?
If you’re serious about reading markets clearly and consistently, the right tools matter. TradingView Pro+ gives you expanded indicators, multiple timeframe views, and a cleaner workspace—so you can apply this guide with precision and confidence.
Use TradingView Pro+ to:
- View multiple indicators without clutter
- Compare higher-timeframe trends accurately
- Save layouts and remove distractions
- Practice disciplined, repeatable chart analysis
* Start using TradingView Pro+ and put this guide to work.
Learn with intention. Analyze with clarity. Act responsibly.

Education First, Participation Second
Digital assets reward understanding, not haste.
This space favors those who prioritize long-term literacy, disciplined learning, and thoughtful participation over short-term hype.
Continued learning is encouraged through community discussion, educational tools, and responsible exploration.
Compliance & Responsibility Note
This content is provided for educational purposes only.
It does not constitute financial, investment, or trading advice.
Readers are encouraged to conduct independent research and understand their own risk tolerance before participating in digital asset markets.
Need More Critical Guidance?
Having a difficult time understanding the practical guide? Request access to the completed algorithm packet and instructions.
The information provided on this page is for educational and informational purposes only and does not constitute financial, investment, or trading advice. Digital assets and cryptocurrency markets involve risk and volatility. Always conduct your own independent research and consult with a qualified financial professional before making financial decisions. The Good Life Collective does not guarantee outcomes or performance.
